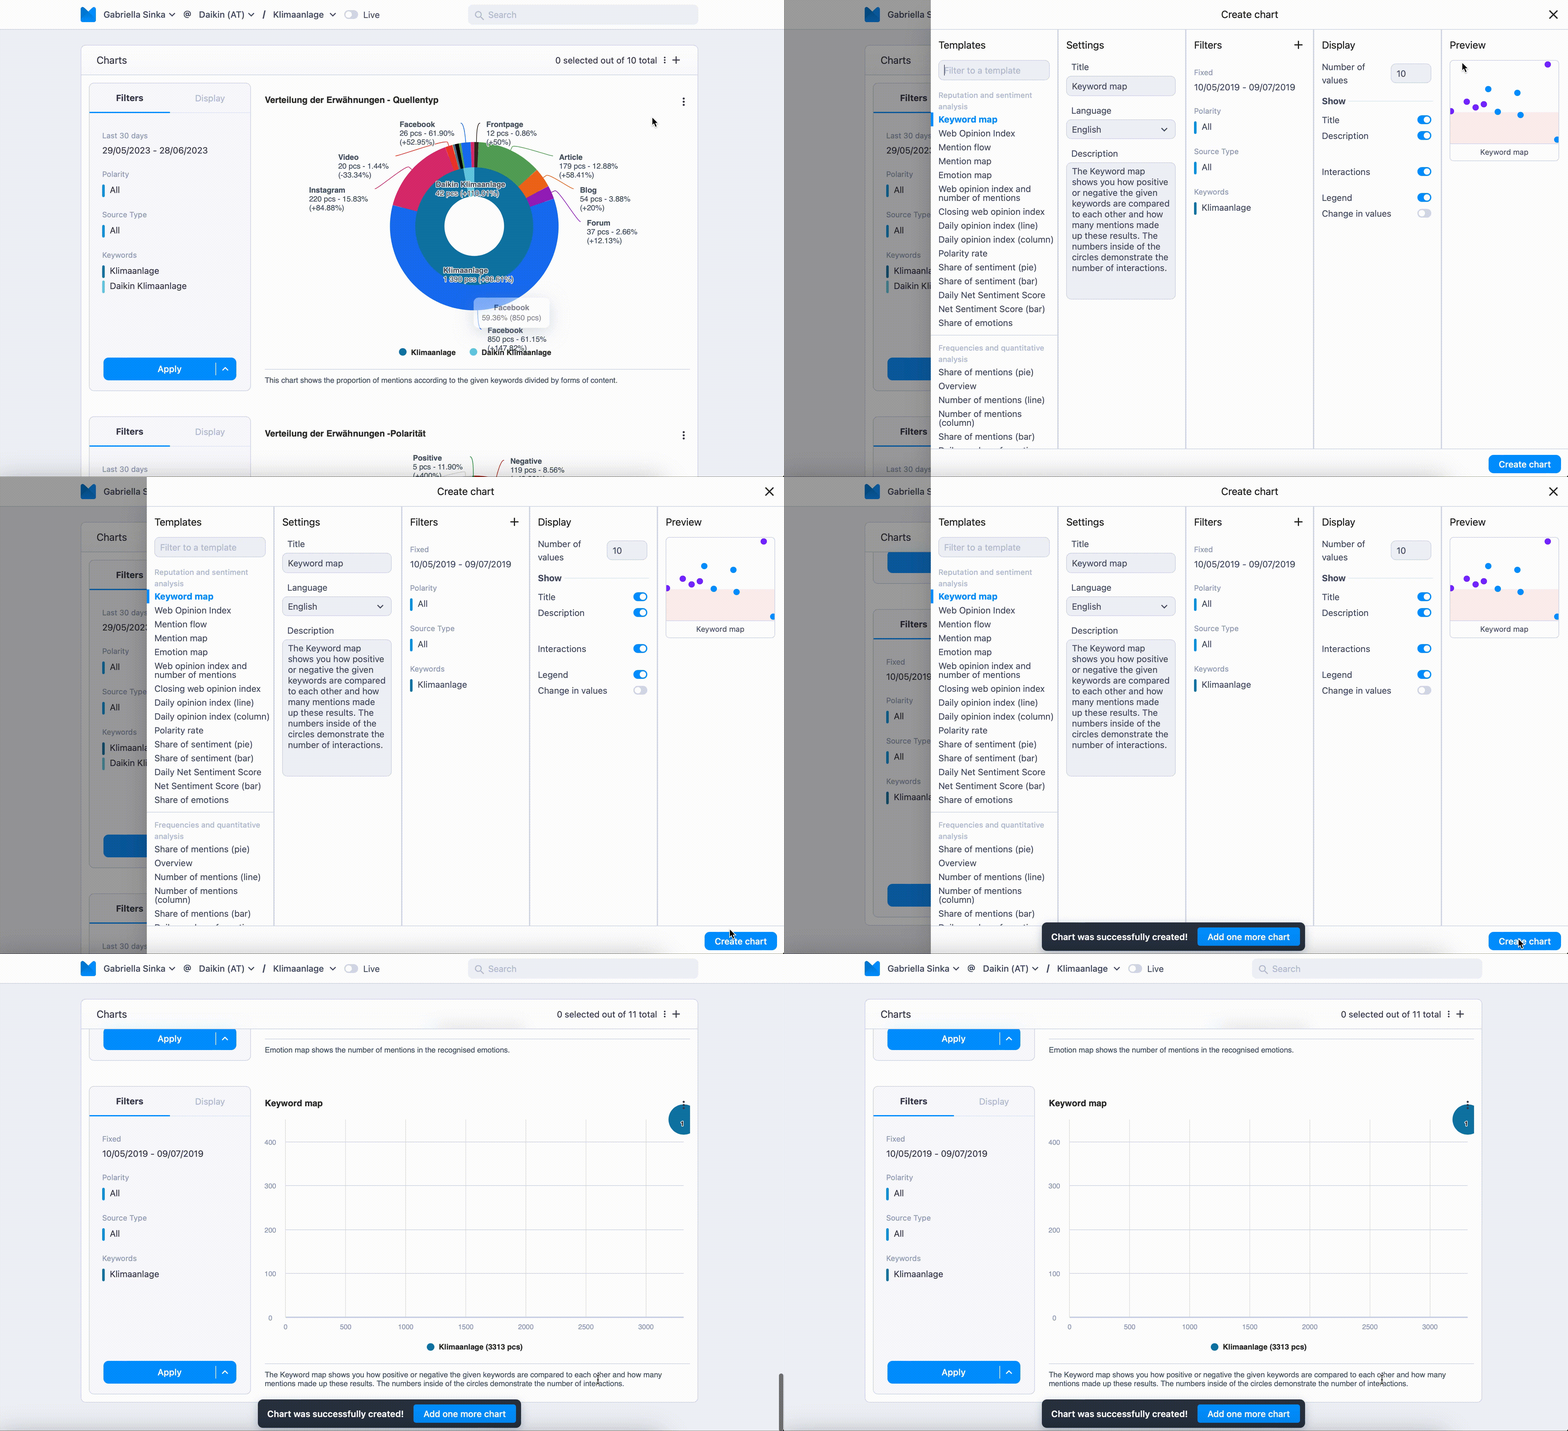
How can I add new graphs to an existing report view?
Open the report you want to add the new chart to, and click on the gray plus sign in the upper right corner. A menu will slide in from the right showing you all options for new charts and also the basic filter options that you need to set up before creating a new chart.
Expert tip: NMI has more than 100 graphs to choose from – all of them have short descriptions and a preview so you can see how they’ll look once created.
