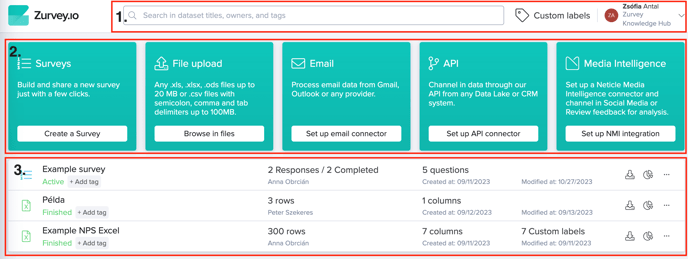
Homepage Navigation
When you’ve logged in, you can see that there are three main sections of the site.

At the top (1.), there is a search bar, where you can search for datasets based on the dataset type, name, tag, or owner as well. Then there’s a button where you can access all your Custom Labels, and finally, a drop-down menu opens when you click on your name at the top right corner. This is where you can access your Activity logs, Archives, Settings, and you can also log out from here.
The next section of the portal (2.) is the data input section: each green tile signifies a certain type of input method.
Depending on the settings of your group, different input options might be available to you, but the range of these can be extended when necessary. However, the default input methods are the following:
- Surveys: create your own surveys and gather customer feedback through participant responses;
- File upload: upload one of your own Excel, ODS or CSV files that contains VOC data to be analyzed;
- Email: set up an Email connector which will then enable Zurvey.io to analyze your desired email traffic;
- API: an API connection can be set up to channel data from any source or system;
- Media Intelligence: data from Neticle Media Intelligence can be integrated into Zurvey.io so you can handle all of your feedback in one platform.
The last section (3.) of the portal’s main page is where you can see all of your existing datasets, from latest to oldest.
Each row shows the following information:
![]()
- what kind of data input was used,
- its status and tags,
- how many rows, records or responses it holds,
- who created it,
- the number of questions/columns,
- the creation and last modification date,
- and the number of applied custom labels, if it has any.
The first icon at the end shows export options. Besides static export options, this is where you can access API credentials and BI connector options as well (if they’re available to you).

The second icon takes you to the analytic dashboard. (Please note that these two icons only appear if the dataset has records in it, otherwise there’s nothing to export and no dashboard to show.)
Clicking on the three dots opens up more options, depending on the group settings, what type of dataset it is, and whether you are the owner of that specific dataset or not (see the extra options that owners have below).

- Survey options: Dashboard, Reanalyse, Preview, Edit, Publish, Copy, Dataset Alerting, Scheduled Export
- API options: Edit, Rename, Copy, Dataset alerting, Scheduled export
- File upload options: Dashboard, Append file, Rename
- NMI integration options: Dashboard, Edit, Dataset alerting, Scheduled export
- Email connector options: Edit, Copy, Dataset Alerting, Scheduled export
If you are the owner of a dataset, you can also Archive it, and Restore or Delete it from the Archive folder afterwards. If Advanced Access Control is turned on for the group where the dataset is located, dataset owners can also Provide access to other users.
To get a detailed description of what each of these options mean, check Dataset functions.